
Using Clinic.js to Optimize Performance for Node.js Applications
Issues
Since I started programming, I have been obsessed with the performance issues of the programs I write. I often wonder if what I wrote is good enough, if it's optimized, or how many users it can handle at the same time... That was the first step that laid the foundation for a deeper understanding of how programming languages work in general, and Node.js in particular.
Over the years, participating in many projects, I realized that optimizing performance is not always easy. There are many things to consider beyond just pondering over code lines. On one hand, optimization takes a considerable amount of time; on the other hand, there are things that need to be prioritized over User Experience.
Nevertheless, optimizing software performance is never unnecessary. You should not rush to produce performance barriers with careless code. Instead, take the time to understand what causes software sluggishness. Then, utilize debugging tools and performance profiling to facilitate the optimization process later.
In Node.js, Clinic.js is certainly a familiar name to many. This is an open-source tool that helps diagnose and treat "diseases" related to performance specific to Node. In today's article, let's see what Clinic.js can do.
Improving Performance
Clinic.js is a tool that helps diagnose and identify performance issues for applications written in Node.js. Although Clinic.js is no longer actively maintained, it still has many powerful features for diagnosing common problems. The documentation of Clinic.js provides detailed guidance on how to use it, so it's best for you to refer to the official documentation; here, I simply summarize what Clinic.js can do.
When discussing the causes of performance degradation, it is generally due to excessive memory usage, excessive CPU usage, or bottleneck issues. We know that a computer has limited resources such as memory, CPU, disk... If these resources are fully utilized, the computer will definitely not operate normally, which affects the entire system where our software is running. Therefore, the key is how to allocate and use resources appropriately.
Heap Profiler
First, let's talk about memory usage. The more memory allocated, the slower the program becomes. Imagine if each query processing allocates 1MB of memory, how much would 1000 queries at the same time cost? That's right, it would be 1GB!
As long as it's a program, it must use memory. Nowadays, we have many programming languages that use automatic garbage collection. This means that garbage will be collected after a certain period of inactivity. Compared to manual allocation, it can be time-consuming and complex. However, this is not always good; often, the garbage collector may not be able to free all excess memory, leading to memory leaks. It must be said that in Node.js, this situation occurs very frequently due to how Node.js allocates memory and the library system.
Clinic.js has a feature called Heap Profiler that easily tracks the amount of memory allocated. From there, it helps you easily pinpoint which areas are using too much memory or experiencing leaks.
For example, after running the analysis, we receive a statistical table as shown below.
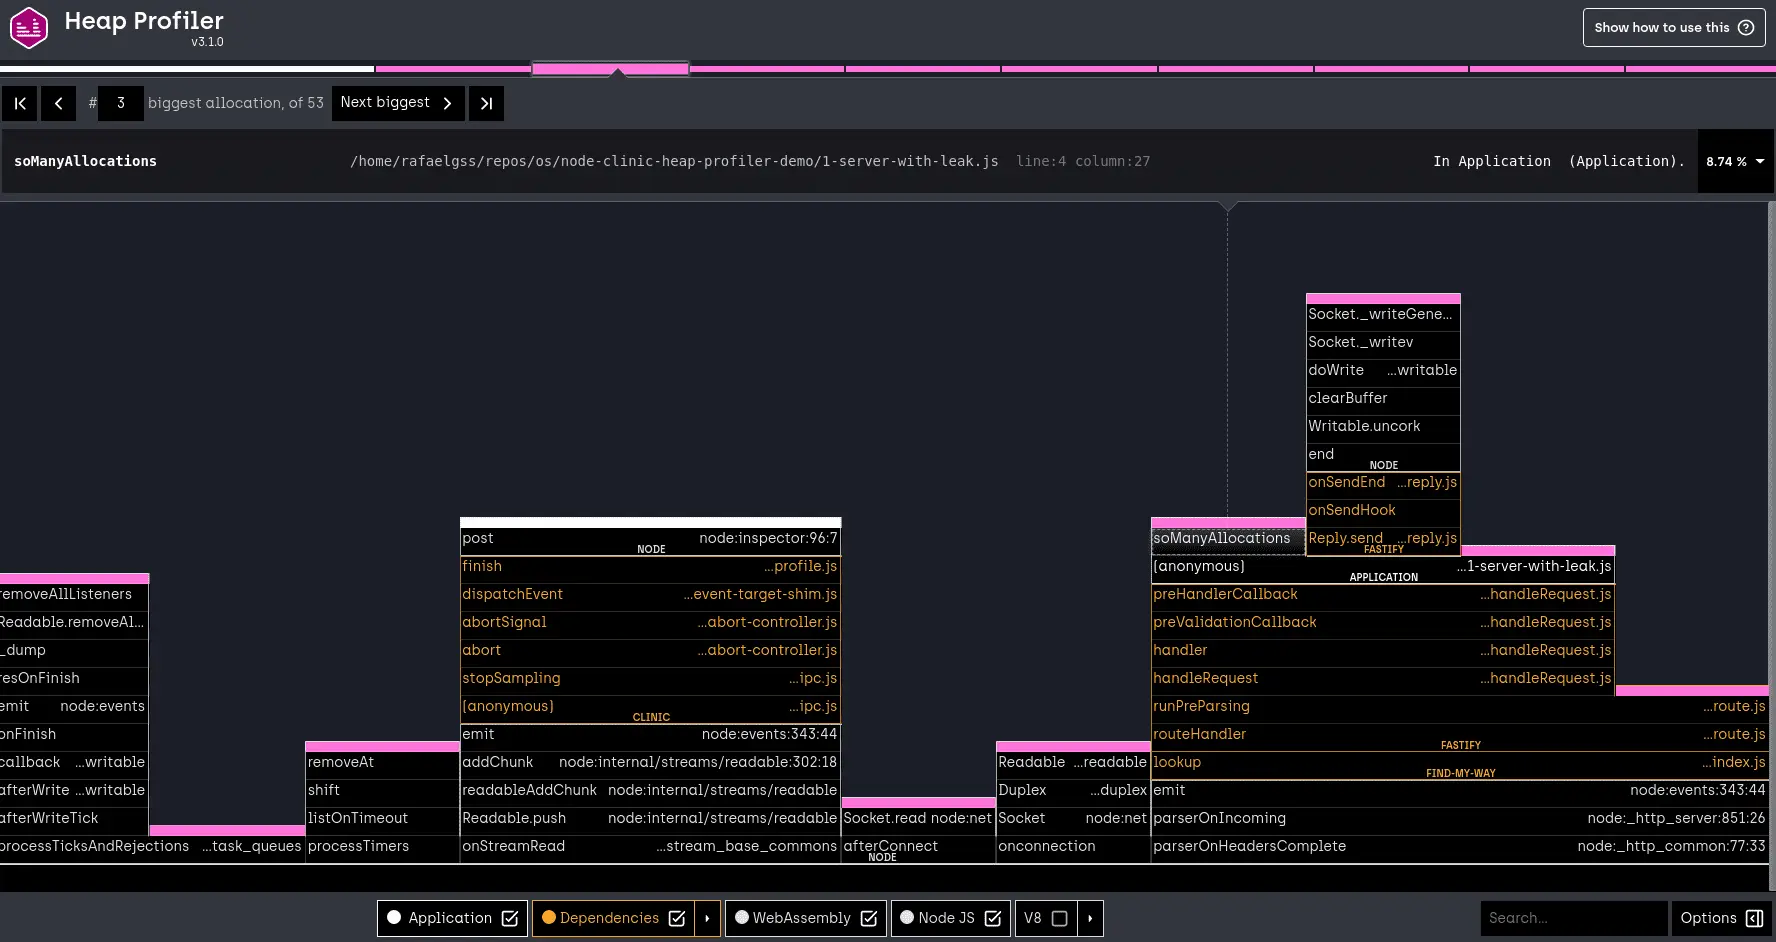
Each block represents the calls of a function. The larger the block, the more memory is being used. Based on this chart, we can easily find their locations because everything is clearly represented.
Doctor
Next is the CPU - which plays a crucial role in processing speed. We all know that Node.js has only one main thread; if it gets blocked, it will cause the CPU to spike continuously, leading to bottlenecks. If you notice that your application is responding slowly or becomes slower as the number of users increases, the likelihood is that the CPU is too high, or the event loop is being blocked.
Clinic.js provides Doctor to help us track statistics such as how CPU, Memory, and Event Loop are functioning, and whether they are effective.
The example below shows the results after running Doctor.
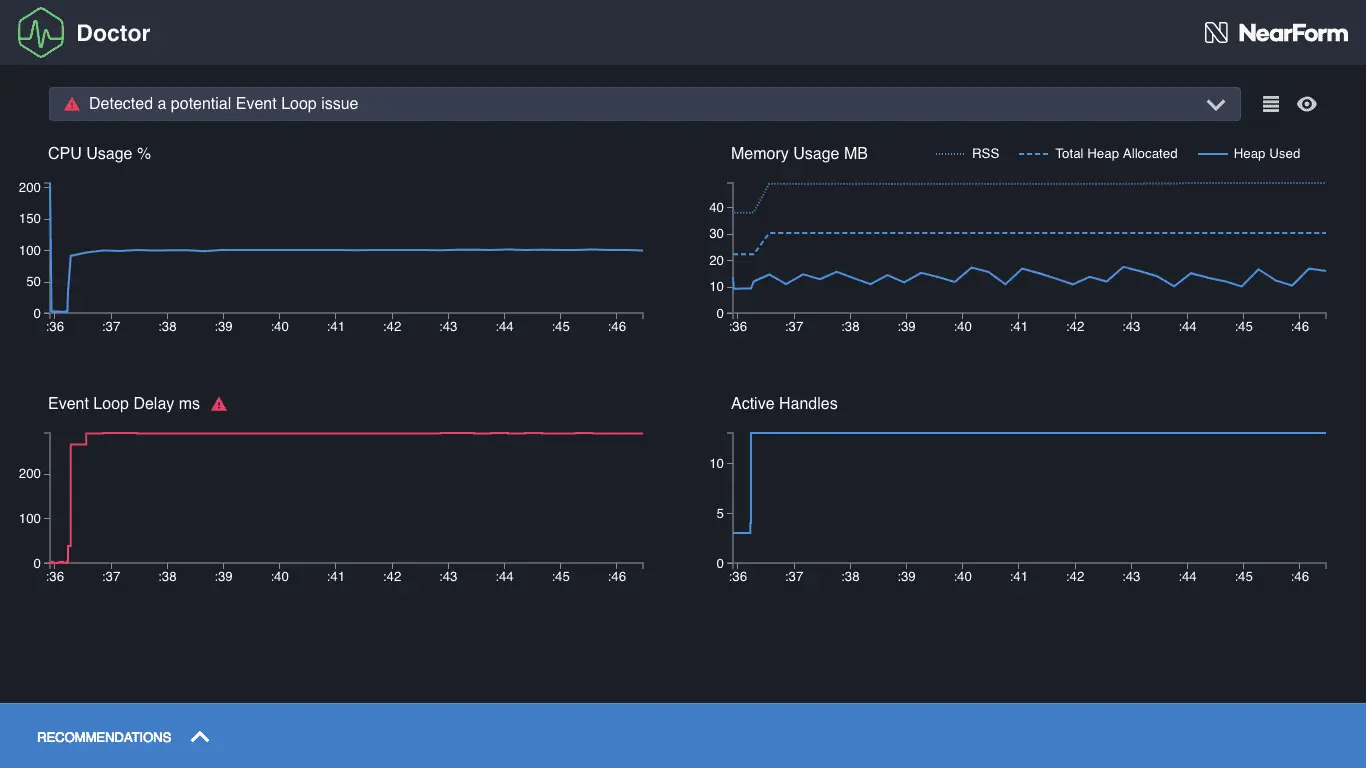
Clinic.js immediately indicates that the event loop is having issues as it is continuously blocked for 300ms. To find out why and where it is blocked, we should use the Flame feature next.
Flame
Over the years, many features have been added, and many people have participated in the development process, which can make the application "heavier." Or in other words, increasingly complex. One function can call another, which can call another function... this layering makes it difficult to identify the exact performance issue when it arises.
Flame is an extremely suitable feature in this case. Flame analyzes and displays exactly where the issue lies, even if they are nested.
For example, the result of Flame is shown below.
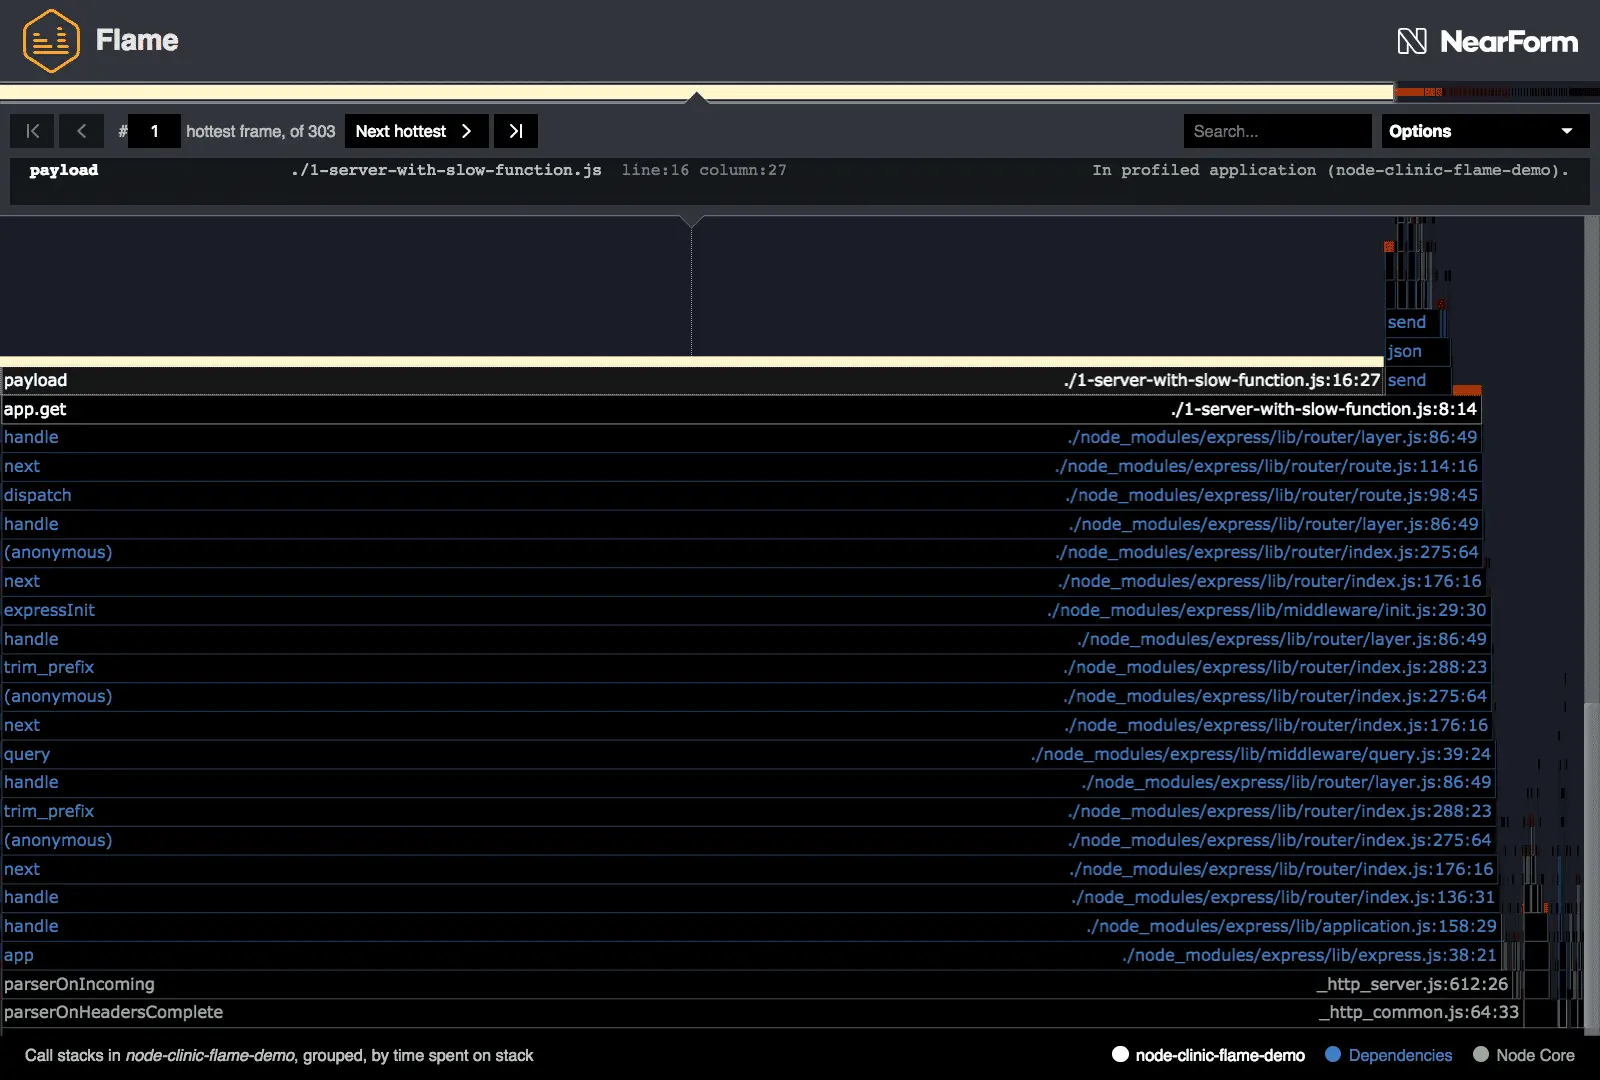
In which, white lines represent the code you wrote, blue represents the code from libraries in node_modules, and gray denotes Node.js code. Typically, white and blue usually take up most of the processing time. You can easily identify which parts need optimization in white or consider switching libraries if blue is excessive.
Bubbleprof
Finally, another interesting feature that Clinic.js provides is Bubbleprof. It draws a map containing bubbles representing a group of asynchronous activities. The larger the bubble, the larger the asynchronous activity there.
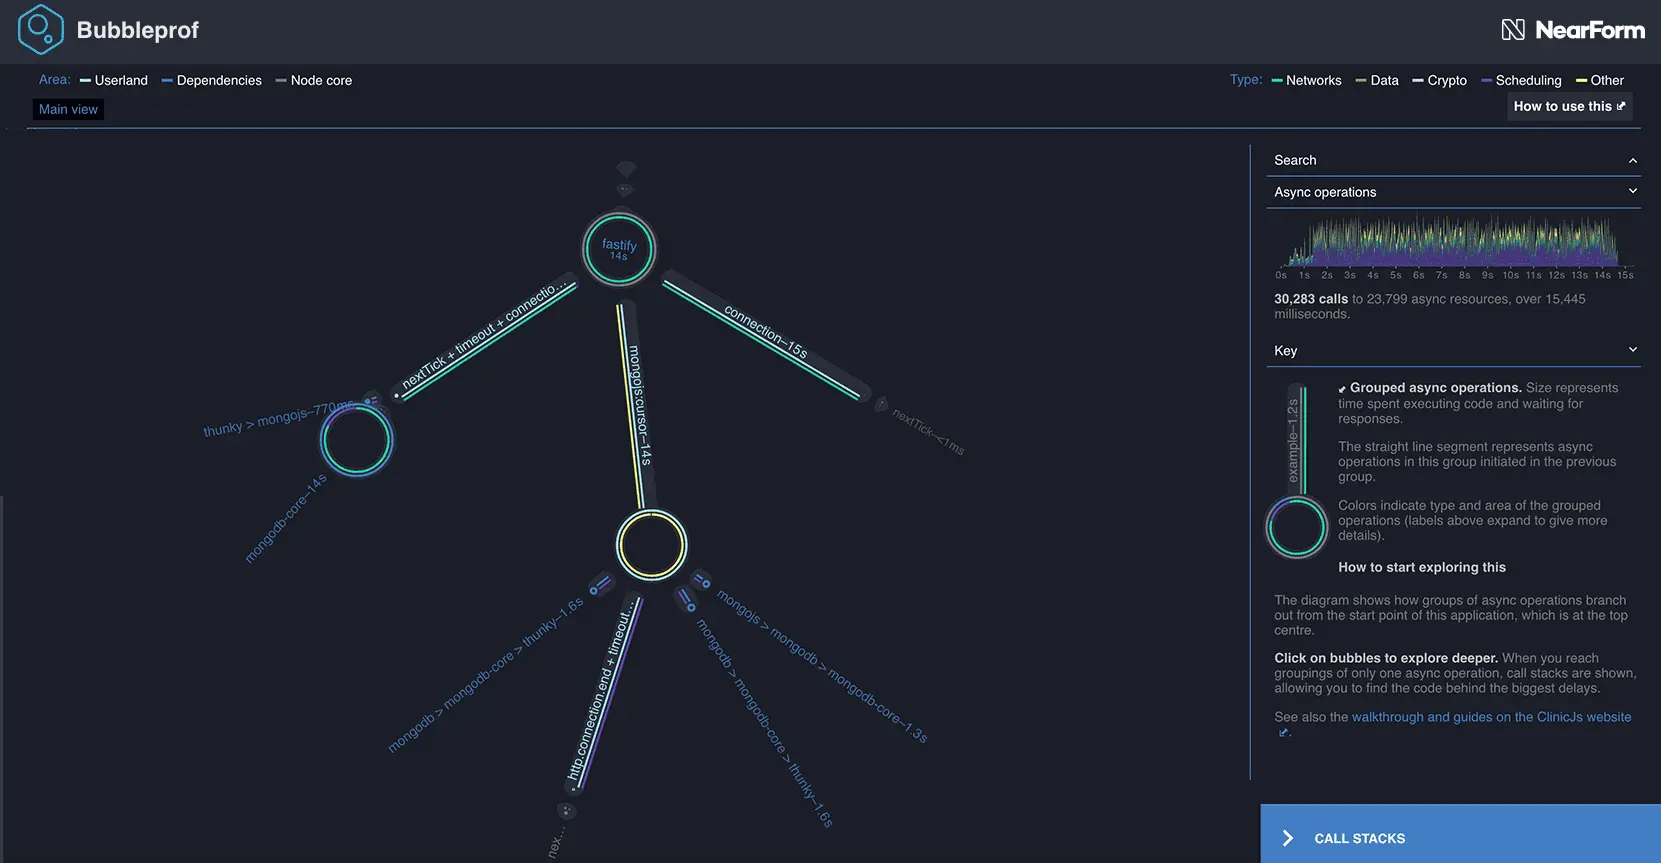
Bubbleprof is used to find bottlenecks within the application by indicating which components are taking too much processing time. Bubbleprof is an advanced feature, so you should refer to the usage guide from the documentation page.