
Debugging Node.js Applications
The Problem
Debugging is an essential skill for every developer. No matter what position or programming language you work with, debugging is crucial to finding and fixing issues in your code. While adding more code increases the risk of introducing bugs, debugging helps us identify the root cause of these errors and verify whether our program is functioning as expected.
Each platform or programming language has its own debugging techniques, and their difficulty varies based on the developer's familiarity with the tools. In Node.js, there are various ways to debug applications. One of these methods is "console.log everywhere". But aside from using console.log, are there any other ways to debug JavaScript/Node.js applications?
Console.log is helpful but not enough
You've learned how to print things to the console using console.log. Whether you want to view the value of a variable or check if a function is being called, console.log is always there for you. You can even use it to print out multiple lines of information to make debugging easier. However, this approach can become problematic, leading to messy code and cluttered console output that makes it harder to diagnose issues or negatively impacts performance.
While the benefits of using console.log are clear in terms of quickly displaying information, overusing it can lead to an overwhelming amount of information in the console. If you are satisfied with using console.log for debugging, then I would like to introduce you to a more powerful method which offers a comprehensive debugging experience.
The Inspector and How It Works
The Inspector is a built-in debugging tool in Node.js. When you start your application with the inspect flag or --inspect option, Node.js starts and listens for the debugger. By default, it listens on 127.0.0.1:9229. To connect to the debugger or use specialized debugging tools, you will need to connect to an address that looks like ws://127.0.0.1:9229/0f2c936f-b1cd-4ac9-aab3-f63b0f33d55e, where 0f2c936f-b1cd-4ac9-aab3-f63b0f33d55e is the UUID of your application.
For example, if you have a file called index.js:
const a = 1;
const b = 2;
const sum = a + b;
When using console.log for debugging, if you want to see the value of sum, you would place console.log(sum) below it. However, when debugging with the inspect flag, the process is as follows:
$ node inspect index.js
< Debugger listening on ws://127.0.0.1:9229/2855e131-b944-4ae4-bb4d-a6d374b83088
< For help, see: https://nodejs.org/en/docs/inspector
< Debugger attached.
Break on start in index.js:1
> 1 const a = 1;
  2 const b = 2;
  3 const sum = a + b;
As you can see, the result is similar, with the line Break on start in index.js:1 indicating that it starts at line 1. Now, enter n and hit enter to move to the next line:
debug> n
break in index.js:2
  1 const a = 1;
> 2 const b = 2;
  3 const sum = a + b;
  4
To view the value of a, you can use the watch command:
debug> watch('a')
At this point, the value of a is not displayed. The watch command simply sets up a watch for the value of a. To see the value, enter n to move to the next line:
debug> n
break in index.js:3
Watchers:
  0: a = 1

  1 const a = 1;
  2 const b = 2;
> 3 const sum = a + b;
  4
In addition to the n command and the watch function, there are many other commands and functions available. For more information, you can refer to the Debugger Command Reference.
At this point, you may find the debugging process difficult and time-consuming. Typing commands like this can be cumbersome, making it hard to keep track of what's happening. However, what I've described above is just the basic debugging process using the command-line interface (CLI). This CLI is the foundation for more advanced debugging tools. In reality, we usually debug our code using text editors or IDEs.
Debugging with Breakpoints in Integrated Text Editors / IDEs
A breakpoint is a position in your code where the debugger stops execution immediately, allowing you to inspect the state of variables at that point. Breakpoints are useful when you want to quickly jump to a suspicious location in your code or check the state of all variables as the code runs up to that point.
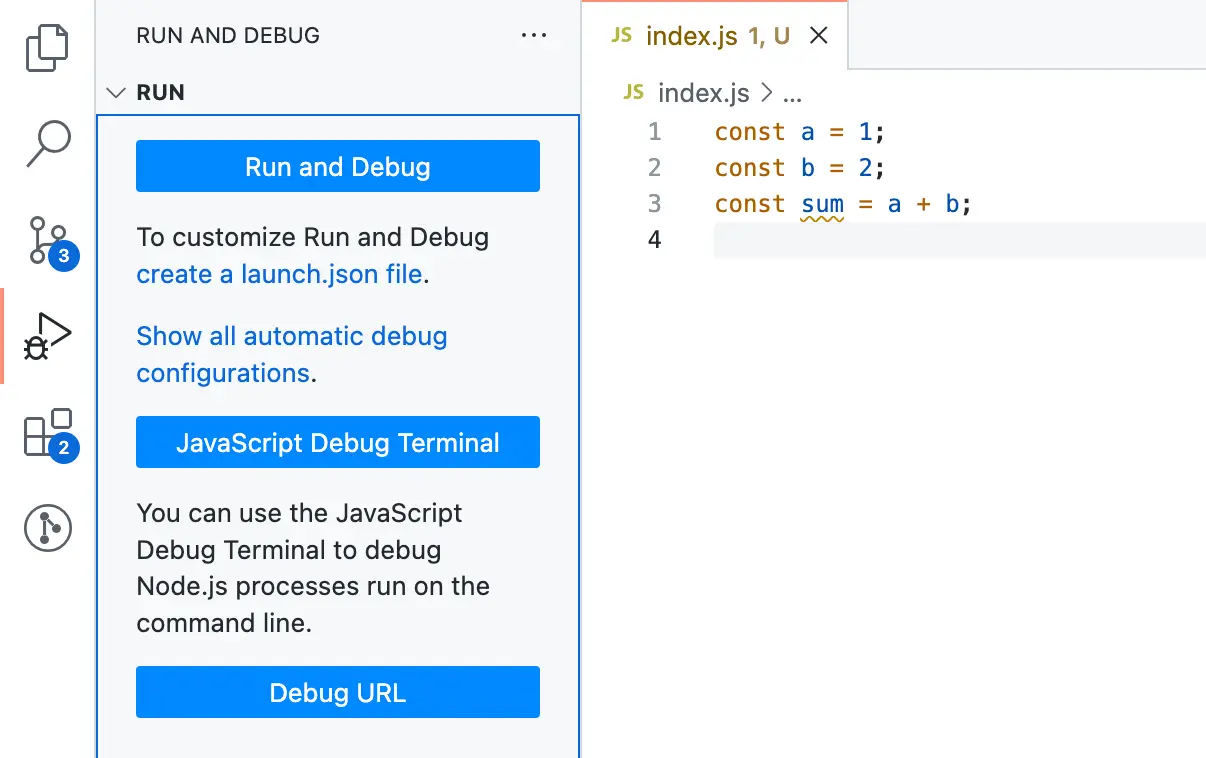
Most Node.js code editors include debugging tools that rely on the Inspector. For example, if you're using VSCode, click on "Run and Debug".
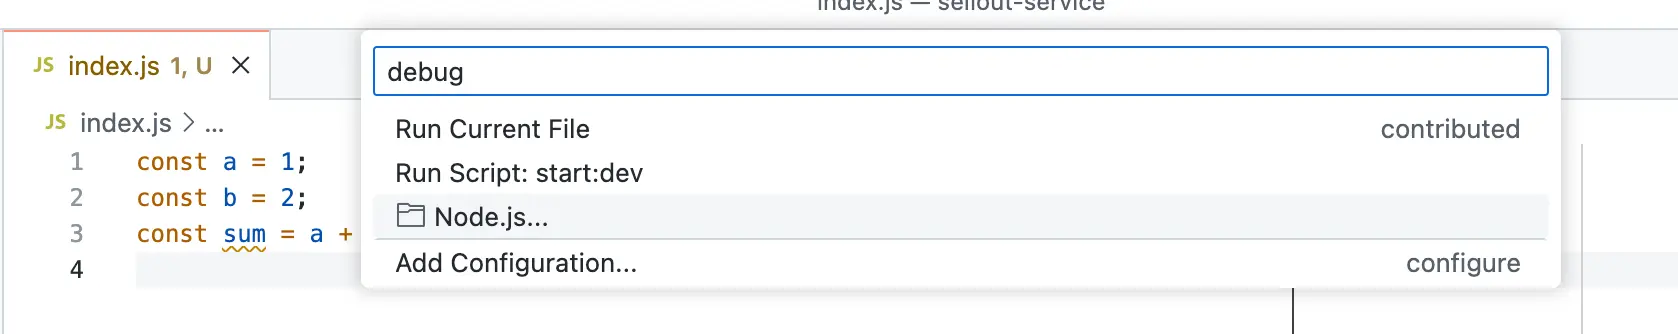
Click on "Show all automatic debug configurations" > "Node.js" > "Run Current file" to start debugging the current file.
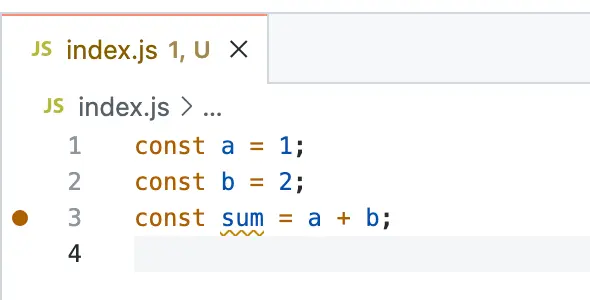
Setting breakpoints is as simple as clicking on the left side of a line number. A red dot will appear, indicating that you have successfully set a breakpoint at that location.
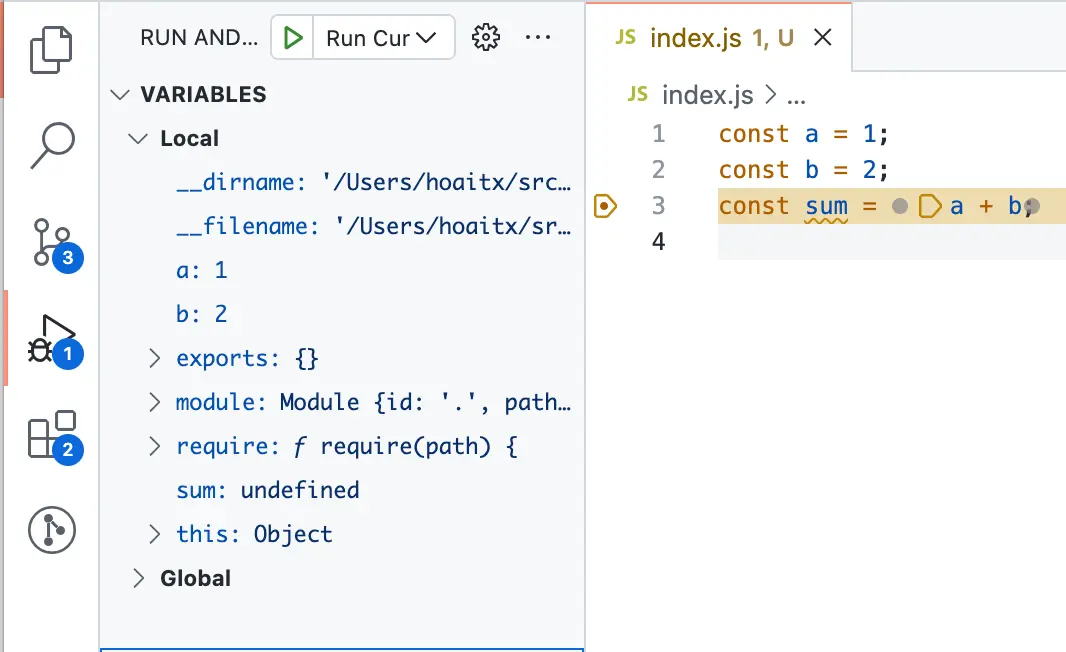
Now, let's run the debug configuration. You will see that the debugger stops at line 3.
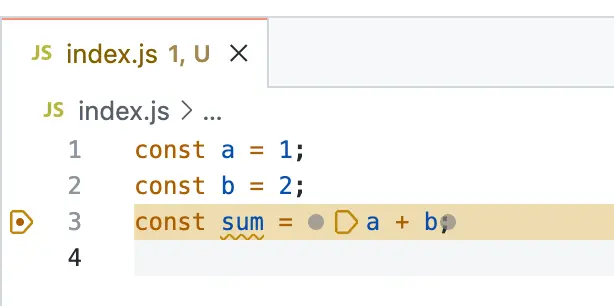
Hover over the variables a, b, and sum to see their current values at that line.
Alternatively, you can look at the panel on the left side, which contains all the data that the debugger collects as the code runs.
To step through or perform other actions during the debugging process, pay attention to the control panel displayed in the VSCode window.
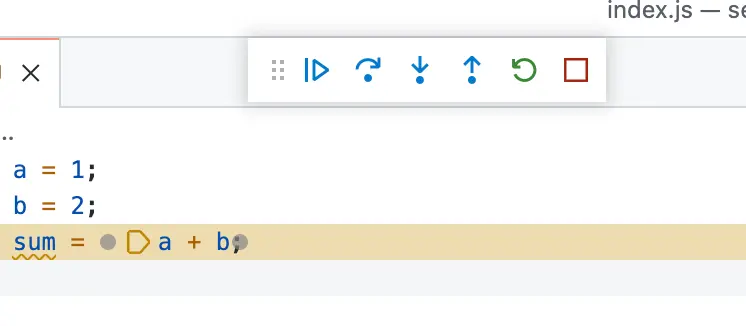
You may need to learn how to use each button and feature mentioned in the article. The first button, for example, allows you to quickly jump to the next breakpoint or end the debug session if there are no more breakpoints.
Finally, you can learn more about debugging JavaScript/Node.js applications with specific text editors or IDEs at Node.js debugging in VS Code.
Conclusion
Debugging is an essential skill for every developer. As long as code exists, bugs will arise. To fix these bugs, you must equip yourself with professional debugging skills. The Inspector is a built-in debugging tool in Node.js, and text editors or IDEs rely on it to provide a more convenient and efficient debugging experience compared to console.log.
References:

Me & the desire to "play with words"
Have you tried writing? And then failed or not satisfied? At 2coffee.dev we have had a hard time with writing. Don't be discouraged, because now we have a way to help you. Click to become a member now!

Subscribe to receive new article notifications

Comments (0)